


Contact
Ready to bring your ideas to life?
Whether you have a project in mind or just want to explore possibilities, I’d love to hear from you. Let’s connect and create something great together!
Turning Data Into Stories, and Stories Into Action

Let’s Learn About Me

Hey there, data dreamer! 👋 I'm Trixie Nicolas, a fresh-out-the-university Computer Science grad (Statistical Computing major 💻📈) with a knack for turning chaos into clarity—using data, dashboards, and just a bit of design flair. ✨
I speak fluent Power BI, chart deep with R and Python, and love diving into SQL to unearth insights. From MS Excel to SPSS and Jamovi, stats and I are pretty tight. 📊
But hey, I’m not just about crunching numbers—I also build stuff! Whether it’s developing web apps with HTML, CSS, and JavaScript, or crafting pixel-perfect designs in Figma, WordPress, and Duda, I’ve got both the frontend chops and the creative eye. 🎨
Need automation? I’ve got you covered with MS Power Automate and Power Apps. Docs and testing? I roll with Draw.io and Visio. Project chaos? Trello and Jira help keep things zen. And when it comes to design, I slay in Canva and Photoshop (yes, even your graphics are safe with me 😎).
Wrapped in productivity suites and powered by curiosity, I’m all about building smart, stylish, and meaningful solutions.
Let’s explore how data meets design, and logic meets creativity—because why not have both?

Data Analyst, Web Designer
MS Excel, MS Power BI, SQL, R, Python
95%R, Python, SPSS, Jamovi
95%HTML, WordPress, Duda, MS PowerApps, MS PowerAutomate, Figma, Draw.io, Jira, Trello
90%Blender, Canva, Adobe Photoshop, Figma
90%Want the full scoop on what I’ve been up to?
This resume sums up my journey—from coding capstones and visualizing insights to leading projects and leveling up teams. 🎯 It’s packed with academic highlights, hands-on experience in data analytics, dashboard development, web design, and a whole toolkit of tech and creative skills. Whether you're here to explore my Power BI passion, project wins, or creative flair, it’s all here—scroll through and get the Trixie timeline!
Here is my career progression
As a full-time remote Data Analyst at Denova Consulting Ltd., I immersed myself in real-world projects that sharpened both my technical and leadership skills. I led the development of interactive dashboards in Power BI, turning raw data into actionable insights for marketing and sales teams. From automating reports and integrating multi-source analytics, to maintaining the company’s website and designing visual content, I bridged data, design, and strategy. I also conducted Power BI training, managed cross-functional projects, and completed trainings in Source-to-Pay and Lean Six Sigma—solidifying my role as a data-driven collaborator and problem-solver.
I successfully completed a 300-hour internship at New Word Diagnostics Inc. During this time, I gained valuable experience not only in enhancing my technical skills across various domains but also in developing strong work ethics, team collaboration, and soft skills.
Here's how my academe time went
College wasn't just about codes and computations—I was also busy shaping stories, designing experiences, and building communities! As a consistent College Scholar (GWA of 1.75 and above 🎓) and proud DOST JLSS Scholar, I was driven to excel not only in academics but also in leadership and creativity. The DOST Junior Level Science Scholarship Program supported my journey as a future S&T professional, recognizing academic excellence and potential.
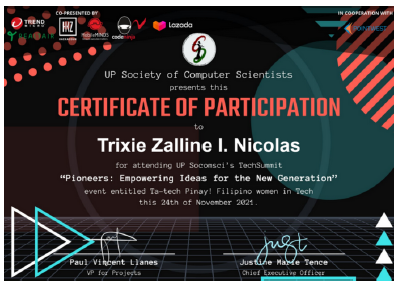
Beyond the classroom, I led layout designs for our yearbook with the ANINAG Editorial Board, explored tech innovations with the Google Developer Student Clubs, and flexed my creative side through the UP Society of Computer Scientists—designing graphics, crafting content, and creating presentations for events. These experiences sharpened my skills in graphic design, project management, content creation, and collaboration, while fueling my passion for tech and storytelling.
Awards/Honors: College Scholar, DOST JLSS Scholar
Organizations/Affiliations
High school was where I first discovered the power of leadership, creativity, and teamwork. As a student with High Honors and a recipient of multiple awards, including the Math Excellence Award and Conduct Award, I was constantly striving for excellence both academically and in extracurriculars. My involvement as a Junior High School Pastoral Council member and as the Head of the Lumen Mundi Club helped me grow in ways I hadn't anticipated.
From managing the club's social media presence to designing graphic materials and contributing to the production of the school’s quarterly magazine, I was not just about numbers—I was shaping stories and building connections. Leading the production of the magazine, from concept to completion, taught me valuable lessons in project management and teamwork. These experiences laid the foundation for my future endeavors in leadership and creative design.
Awards/Honors: with High Honors, Math Excellence Award, JHSPC Outstanding Officer, Conduct Award, Punctuality Award, BulPrisa Math Competition School Representative (JHS Level)
Organizations/Affiliations
Here’s where all the magic happens! ✨
From dashboards that tell data stories to apps that solve real-world problems, this portfolio is a curated collection of my proudest projects. Dive into data visualizations, explore machine learning studies, check out web builds and app designs, or take a peek at my creative side through graphics and animations. Whether you're into insights or interfaces, there’s something for you here. Click through and explore each domain that brings my skills to life!
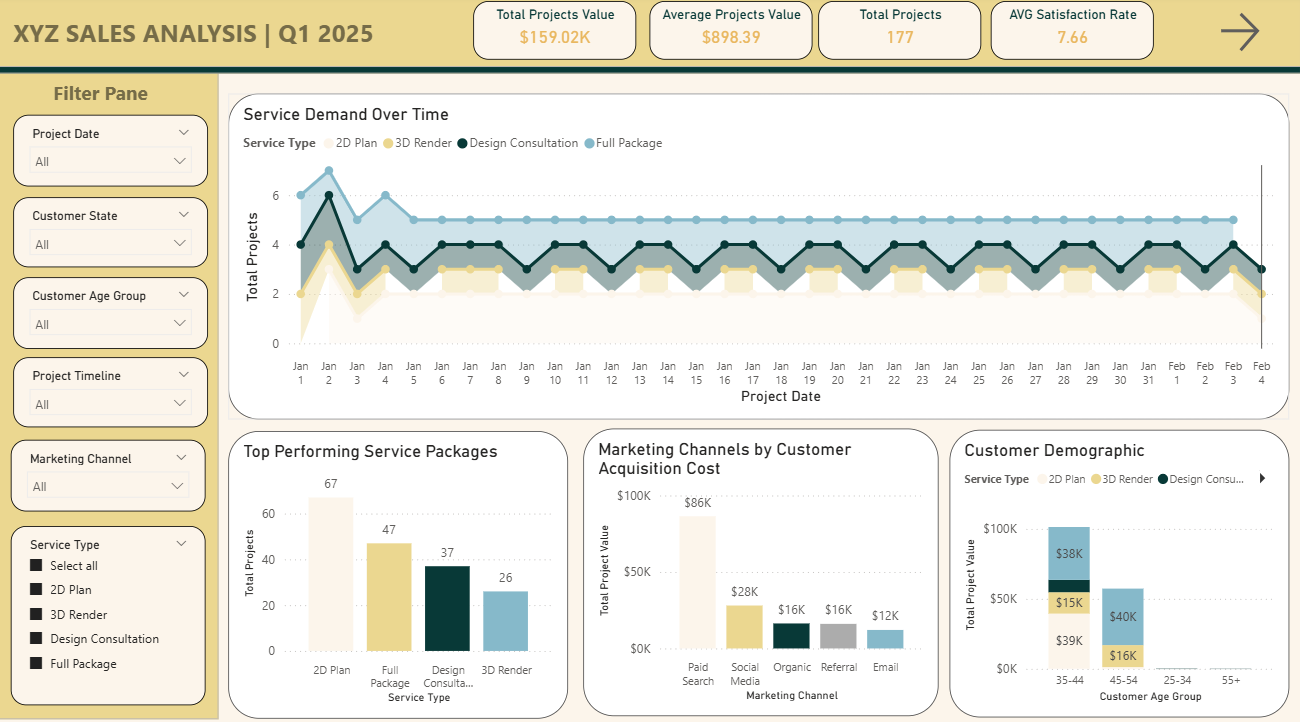
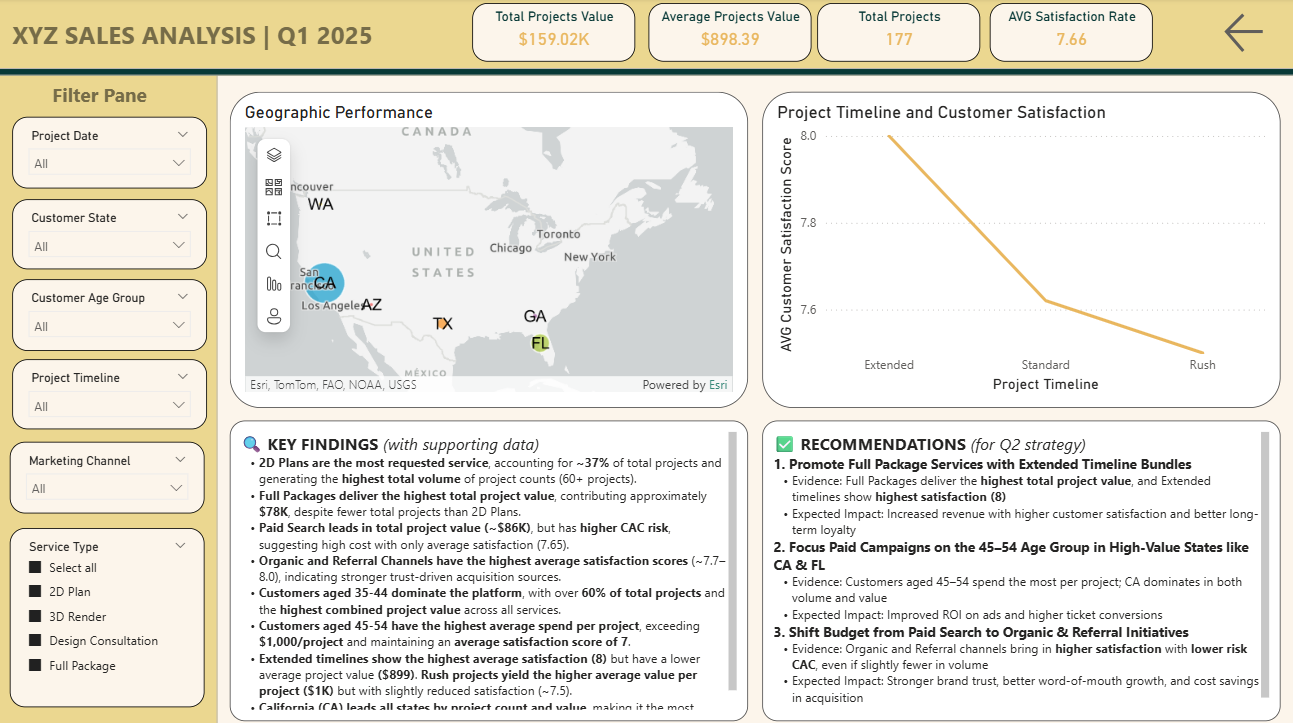
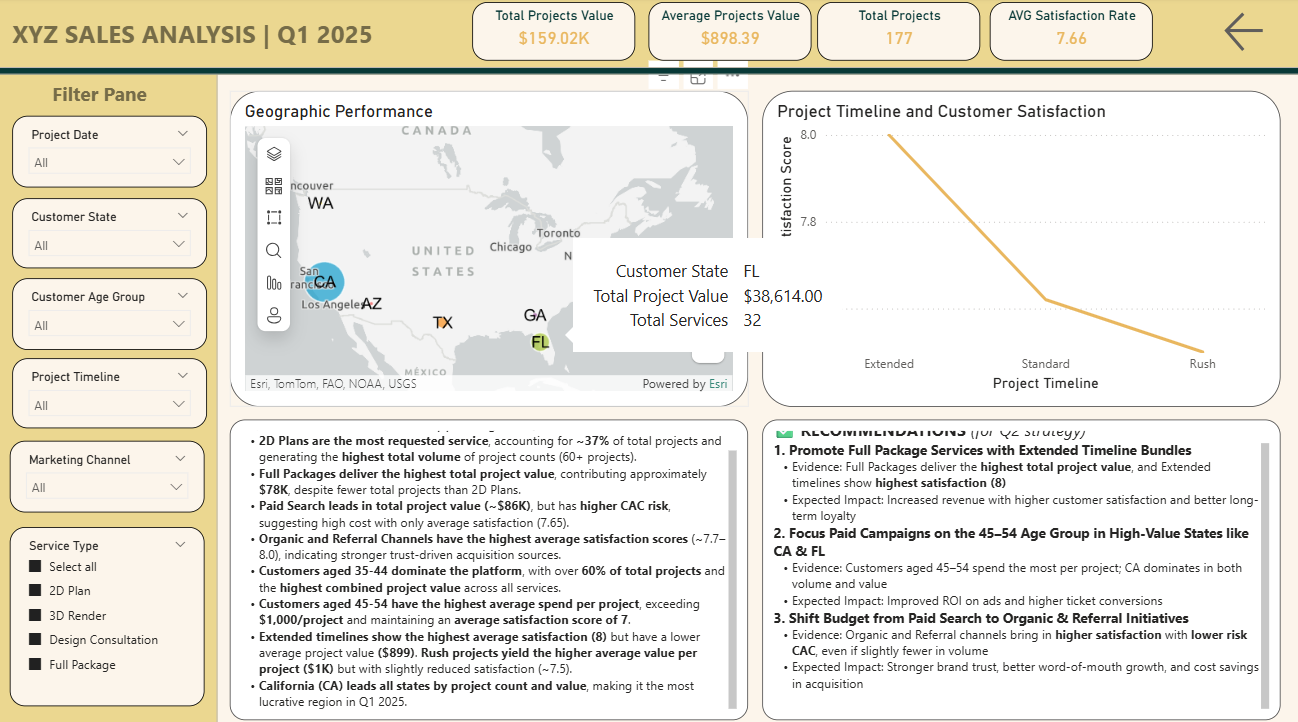
Developed a simple Power BI dashboard to visualize and analyze sales performance of an Online Landscape Design Platform.
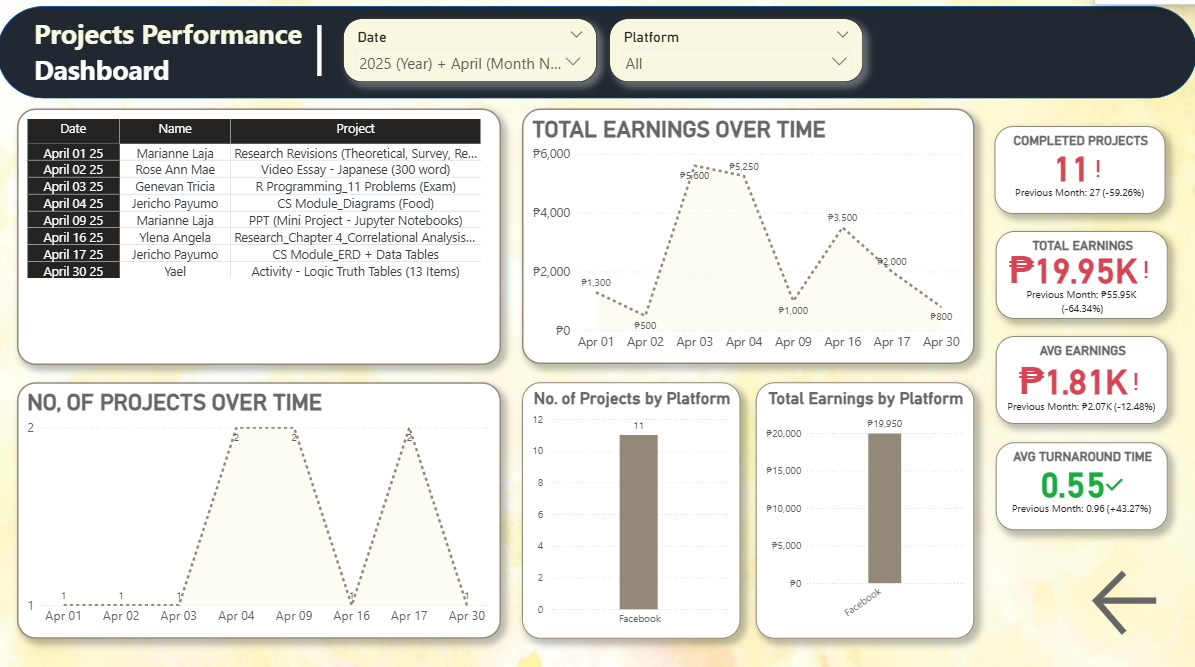
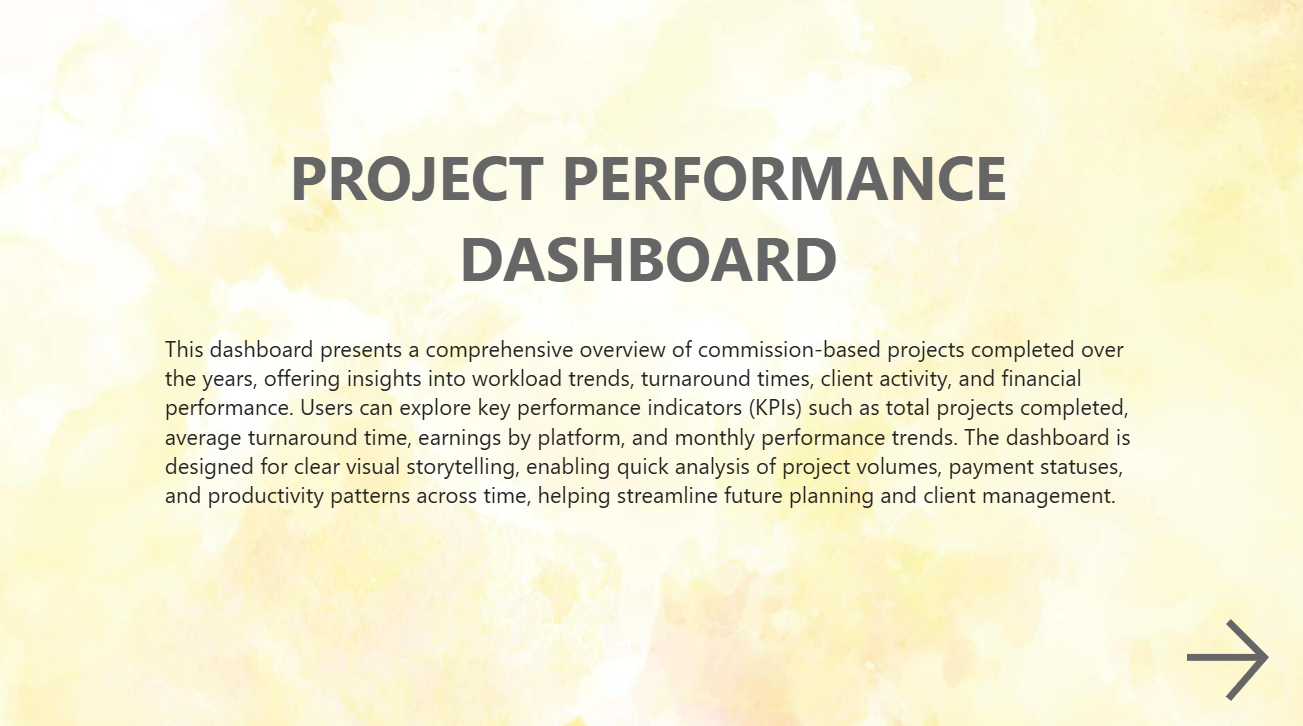
Developed a simple Power BI dashboard to visualize and analyze years of commission data, highlighting project trends, client insights, and performance metrics.
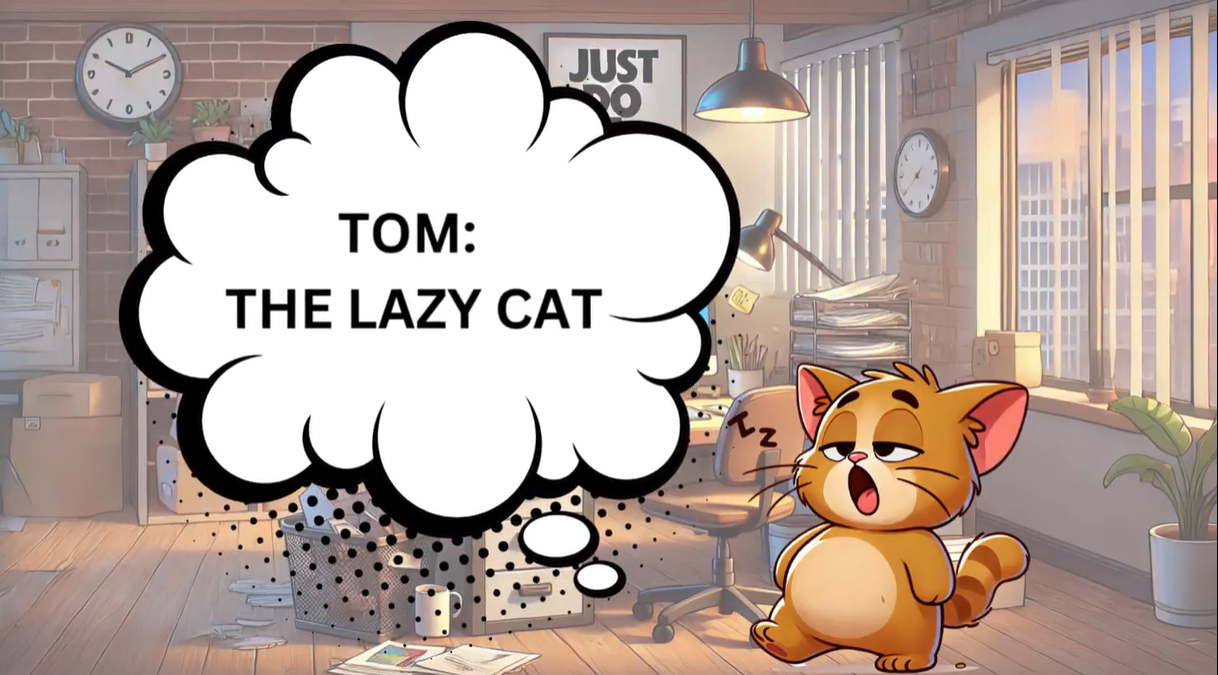
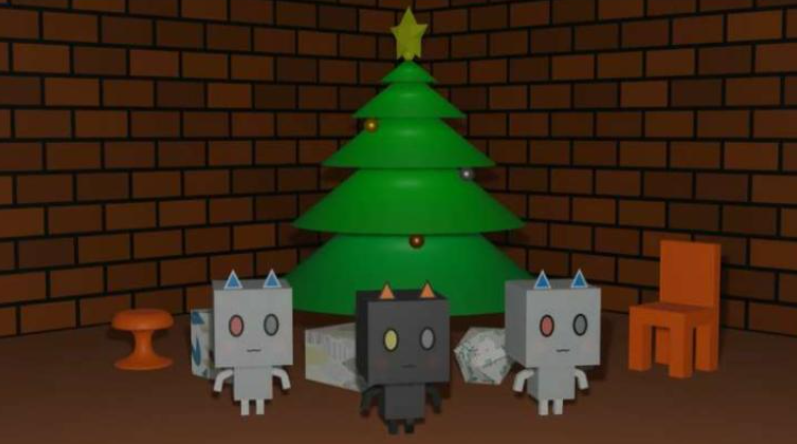
Developed a short 3D Animation for kids featuring cats.
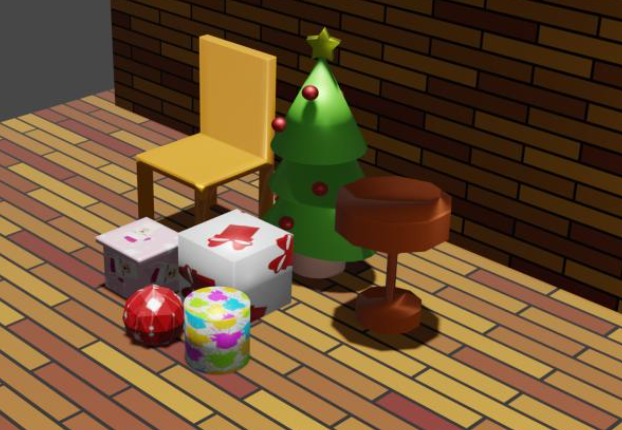
Co-developed an animated music video. The project involved 3D modeling in Blender to create a fun and festive video of animals dancing to a Christmas song.
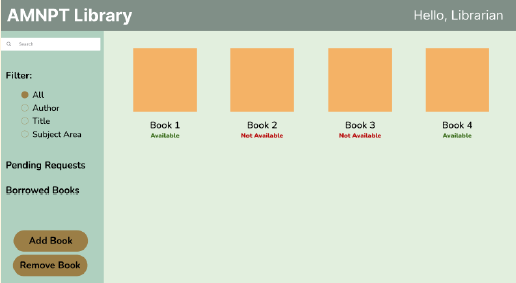
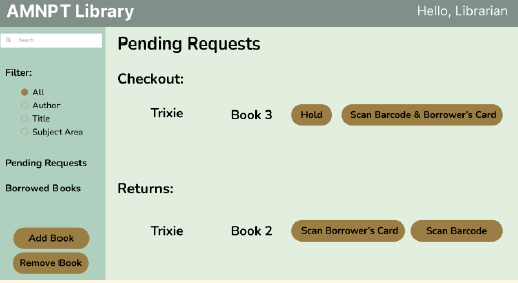
A creative design completed in just 1 hour as part of a class project. Showcasing my time efficiency and creativity, the system's functionalities were provided, and I quickly transformed them into an intuitive and functional design.
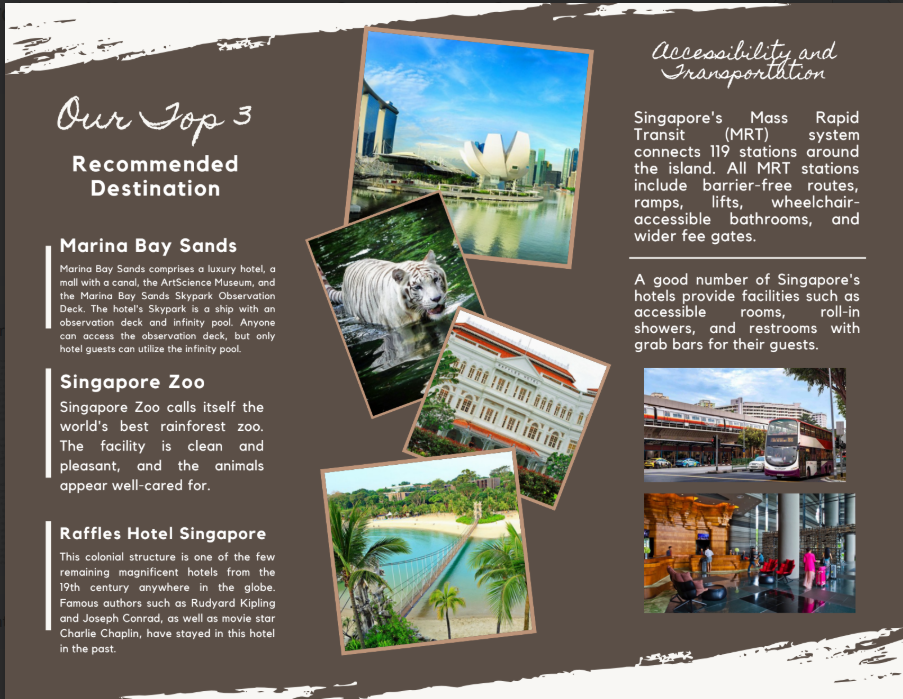
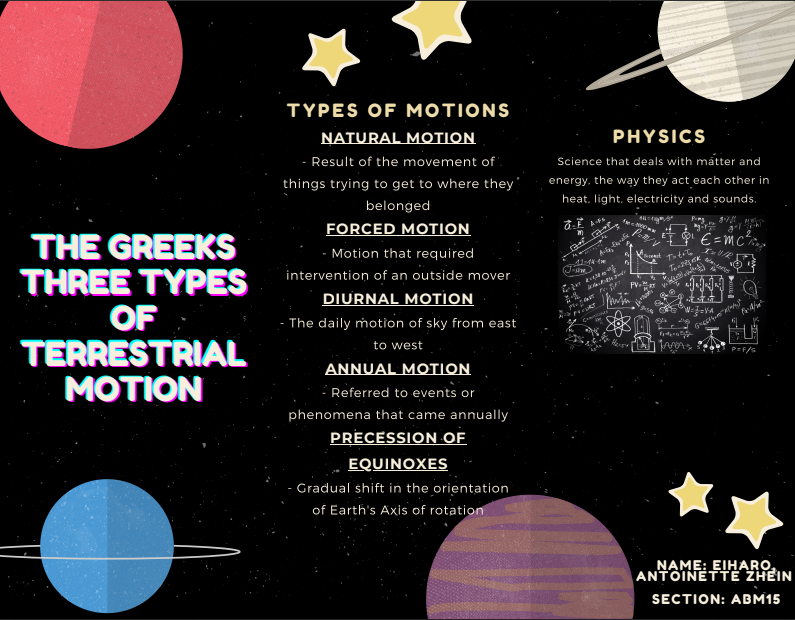
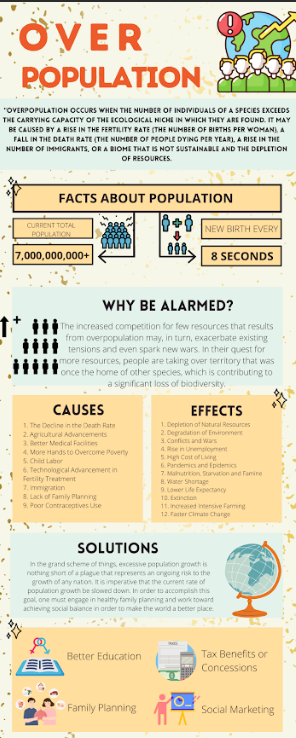
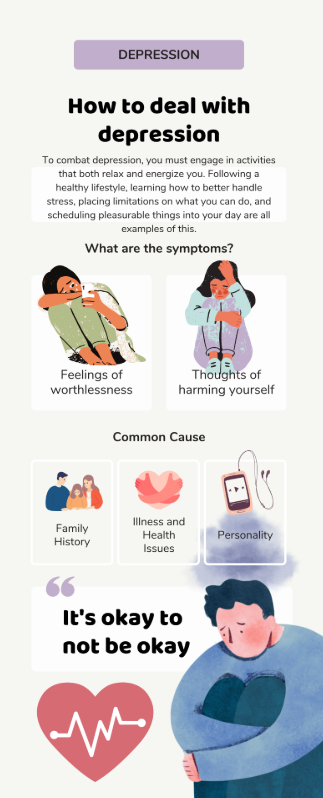
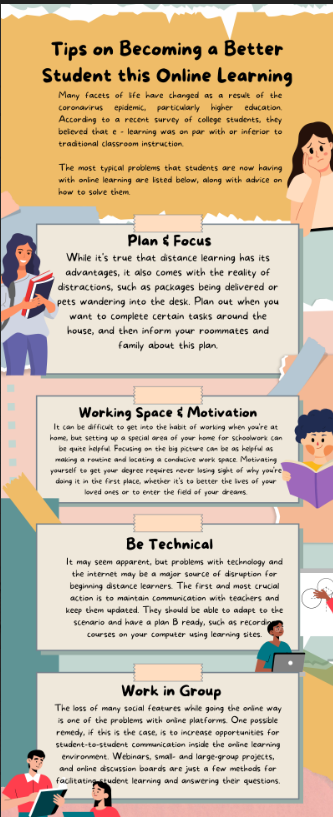
I have taken on a variety of commissioned graphic design projects. From publication materials, posters, flyers, and infographics to brochures, ads, and complete brandkits, I have created designs that effectively communicate each client’s message and vision.
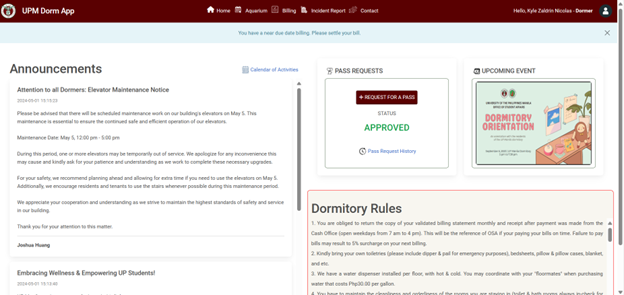
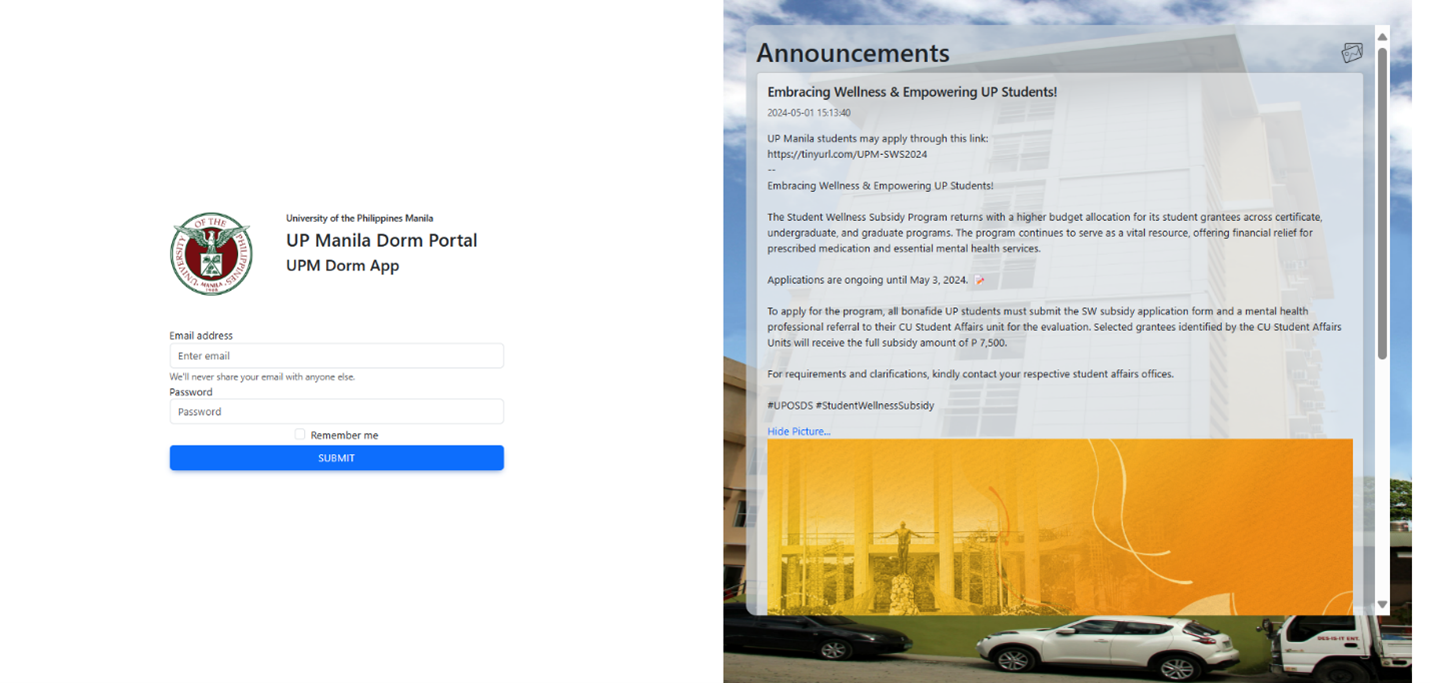
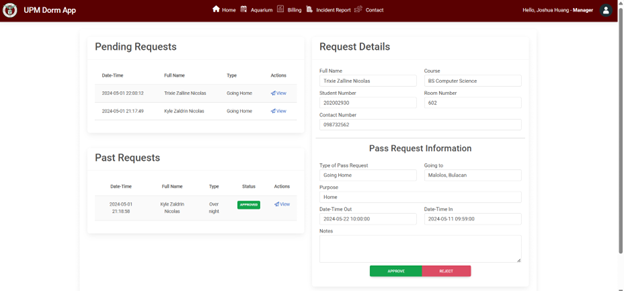
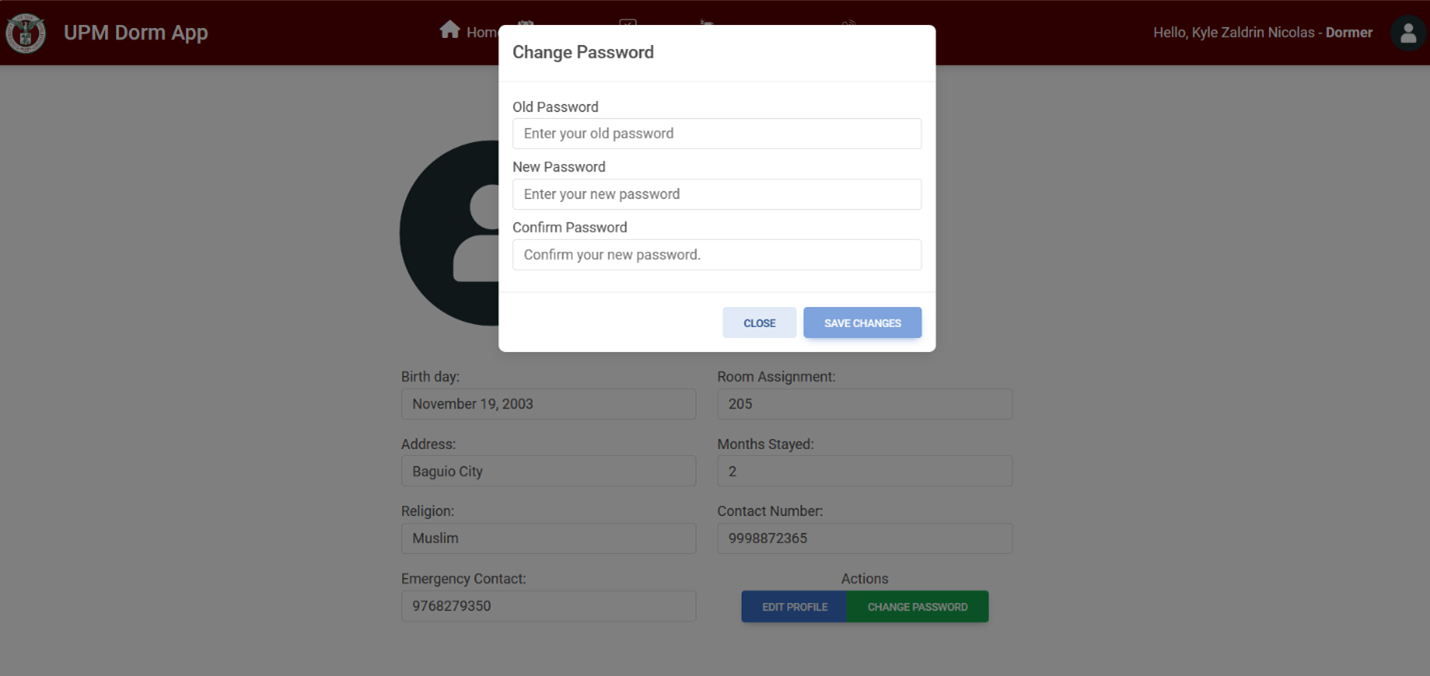
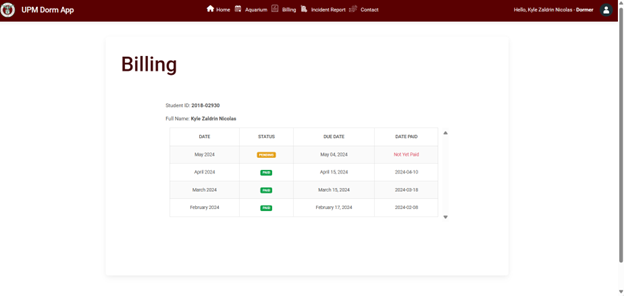
Developed UPM DormApp, a web application designed to streamline dormitory operations at the University of the Philippines-Manila, enhancing user satisfaction and operational efficiency through digital solutions.
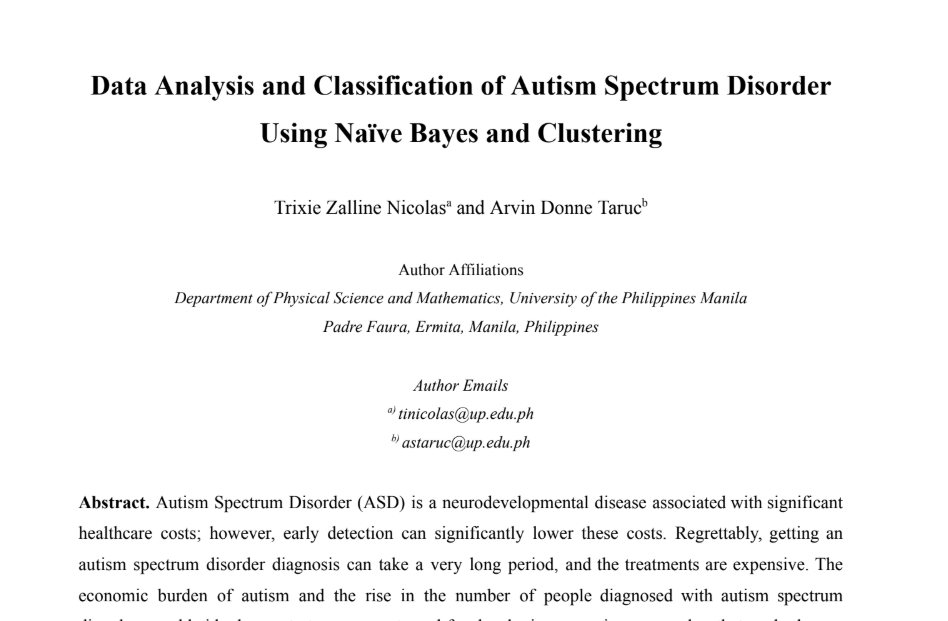
Co-authored a paper on the development of efficient and accessible ASD screening methods, analyzing a proposed dataset with 20 features to improve classification accuracy using Naive Bayesian and Clustering Algorithms.
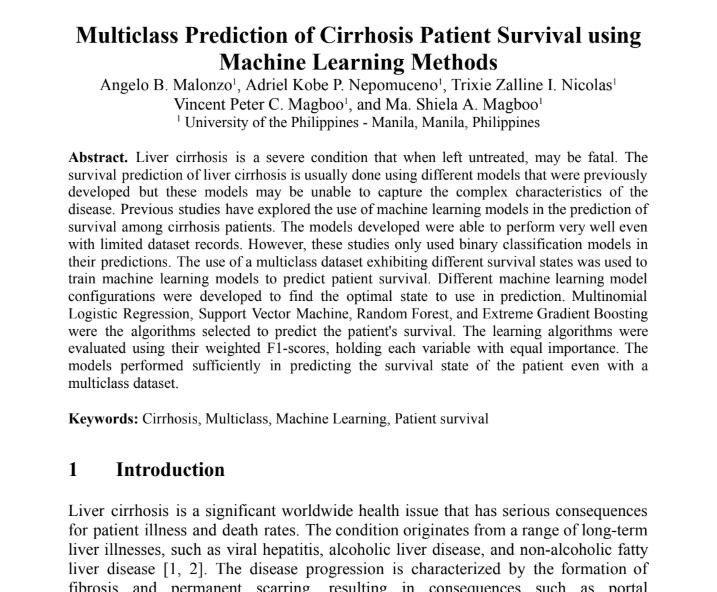
Co-authored a paper on multiclass prediction of liver cirrhosis patient survival, using machine learning models like Multinomial Logistic Regression, SVM, Random Forest, and XGBoost to enhance prediction accuracy.
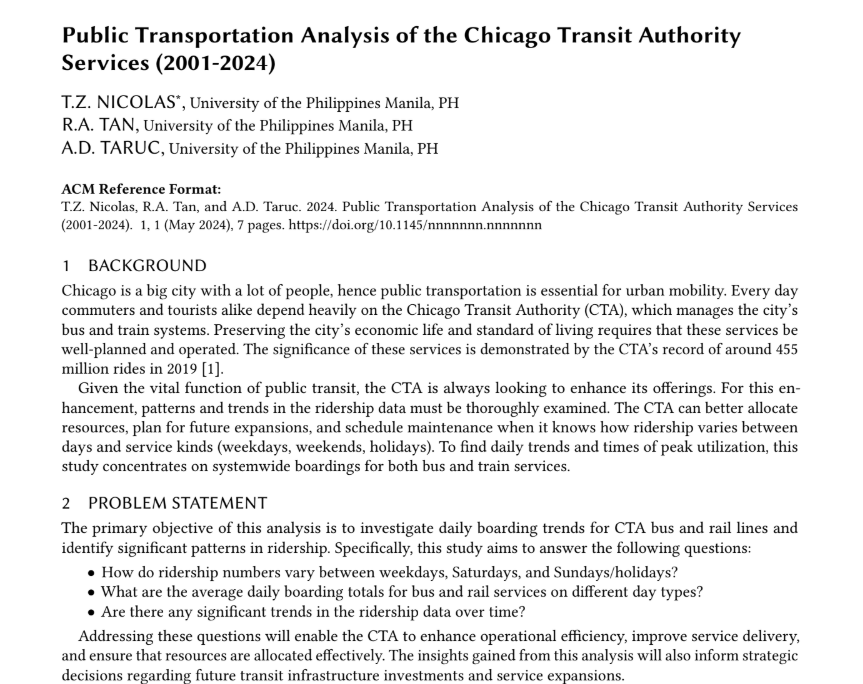
Co-authored a paper analyzing ridership trends in the Chicago Transit Authority (CTA) services from 2001 to 2024, identifying key patterns to enhance operational efficiency and guide future planning.
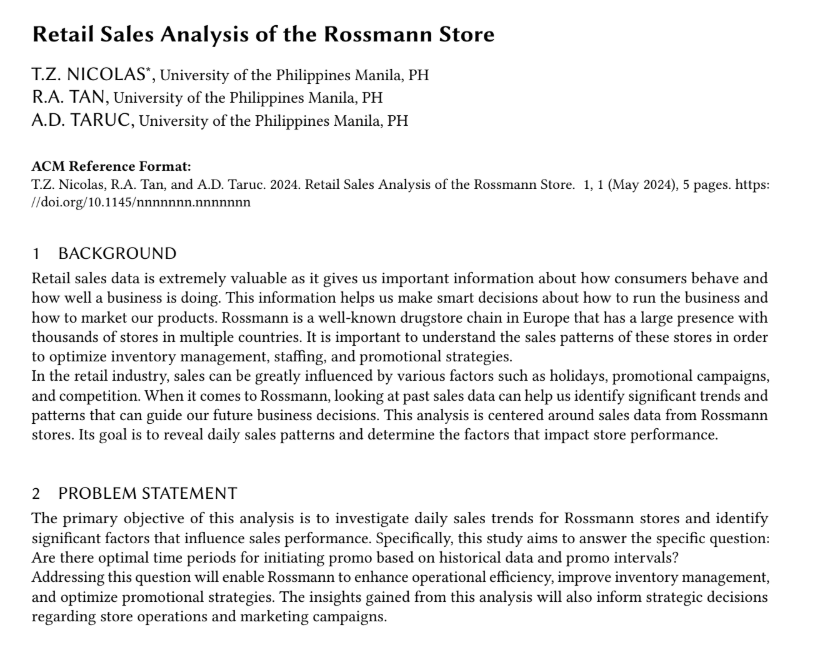
Co-authored a study on retail sales analysis for Rossmann stores, focusing on identifying optimal promotional periods based on historical data and promotional intervals to enhance sales and operational efficiency."
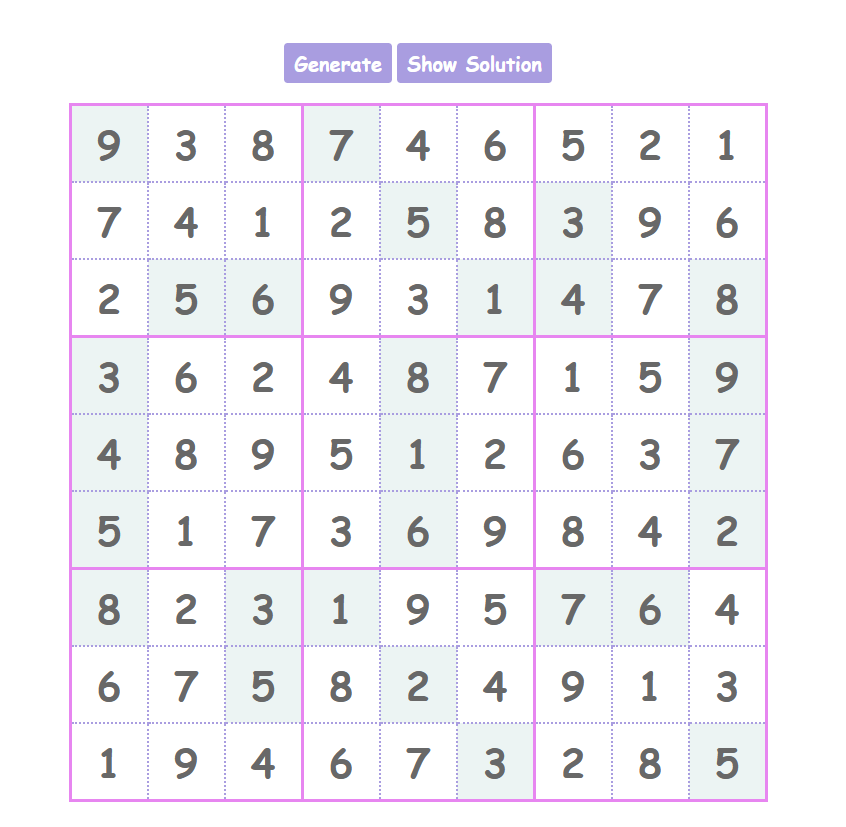
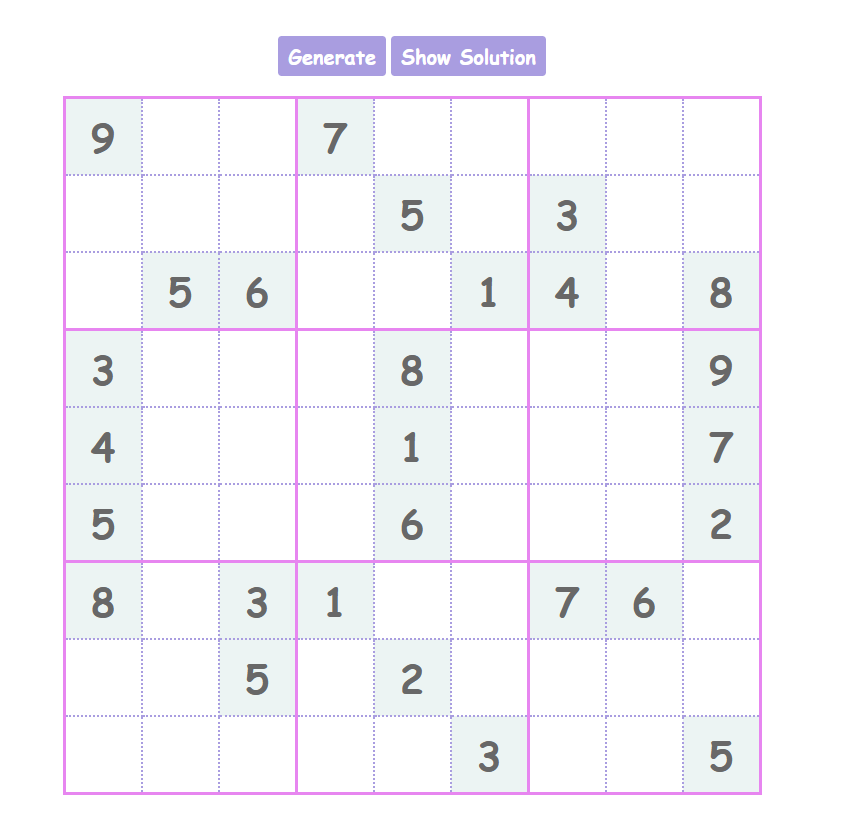
Developed a simple and engaging Sudoku game using HTML, offering an interactive puzzle experience for users to test their logic and problem-solving skills.
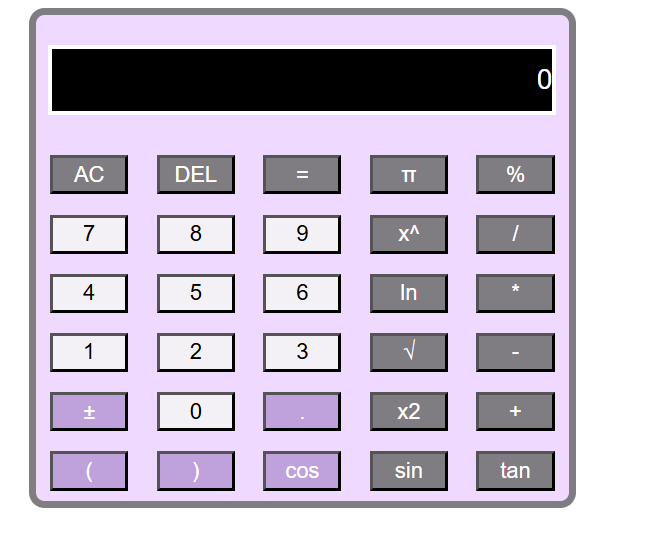
Developed a functional scientific calculator in HTML, providing users with a wide range of mathematical operations for complex calculations.
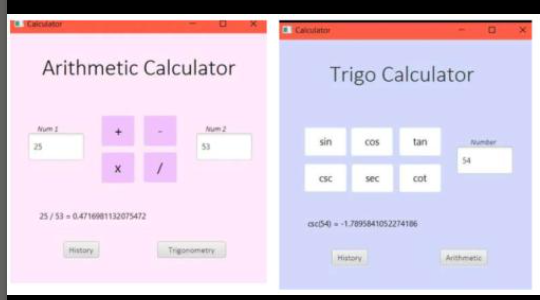
Developed functional calculators using Java, providing users with a wide range of mathematical operations for complex calculations.
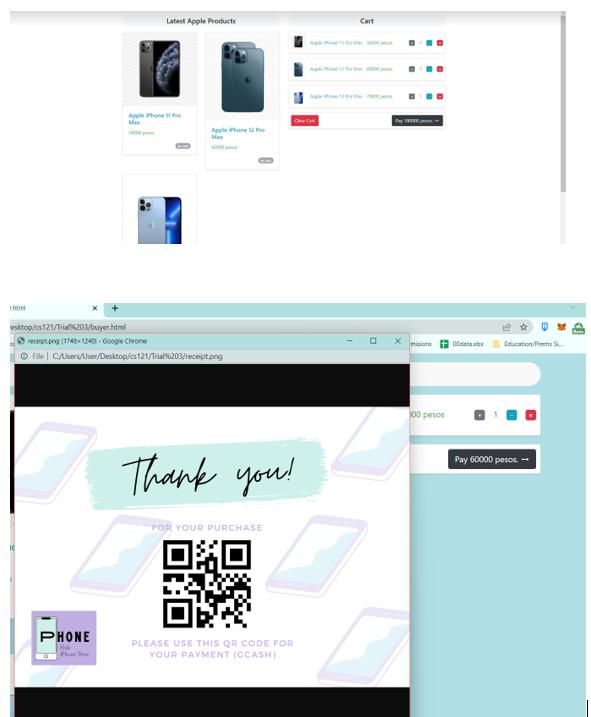
Co-developed an e-commerce website "PhoneHub" with my classmates that sells phone products. This website, built using PHP, features a comprehensive product catalog, shopping cart functionality, and secure user authentication. The project aimed to provide a seamless online shopping experience for users, complete with search and filter options, product reviews, and payment gateway integration
Certifications & Courses: A Journey of Continuous Learning and Skill Growth ✨
Learning doesn’t stop in the classroom—and I made sure to keep growing beyond it! From online courses to interactive workshops and industry-led webinars, I’ve earned a range of certifications that sharpened my skills in data analytics, graphic design, change management, and more. Each certificate represents a step in my continuous journey of growth—whether it’s mastering Power BI, diving into design principles, or enhancing my analytical thinking through Python, R, and AI tools. These experiences reflect my commitment to lifelong learning and staying ahead in a fast-evolving digital world.
Maven Analytics
Maven Analytics
Maven Analytics
University of the Philippines
LinkedIn Learning
LinkedIn Learning
LinkedIn Learning
LinkedIn Learning
LinkedIn Learning
LinkedIn Learning
LinkedIn Learning
LinkedIn Learning

LinkedIn Learning
Pro5.ai
Xaltius
UP Society of Computer Scientists
University of the Philippines
University of the Philippines
From uncovering insights in data to designing intuitive digital experiences, I offer a versatile blend of technical expertise and creative flair. Whether you need powerful dashboards, in-depth research, dynamic web solutions, or compelling visuals, I’m here to bring your ideas to life with precision and impact.
Explore my core service areas:
Turning raw data into clarity.
I create impactful dashboards and visualizations using Power BI and Excel, backed by solid data handling with SQL, R, and Python.
Driven by data, powered by insight.
From statistical modeling in R and SPSS to research analysis with Jamovi and Python, I deliver evidence-based solutions that make sense.
Bringing ideas to life online.
I build sleek, responsive websites using HTML, CSS, JavaScript, and CMS tools like WordPress and Duda—enhanced with automation via PowerApps and PowerAutomate, plus efficient documentation with Draw.io and project coordination in Jira and Trello.
Designs that speak, visuals that connect.
With Canva, Figma, and Adobe tools, I craft eye-catching graphics and user-friendly designs that blend form with function.
Got questions? I’ve got answers! Whether you're curious about my process, tools, or how we can work together, this section covers the most common things clients ask. If you don’t see your question here, feel free to reach out—I'm always happy to chat!
I've always been fascinated by the way data tells a story—and I wanted to be the storyteller. Power BI stood out because it blends analytics and design, letting me turn raw numbers into interactive, visually compelling dashboards. It's powerful, user-friendly, and perfect for someone like me who enjoys both the logic of data and the creativity of design. 💡📊
For me, it’s all about synergy. I see data like raw material and design as the shape it takes. Whether I’m analyzing trends or designing a dashboard, I use tools like Canva, Figma, and Power BI to bring structure and beauty together. My background in content creation and graphic design helps me build solutions that are not just functional—but also engaging and user-friendly.
I’m super excited about projects that combine data visualization, automation, and user experience—like building real-time dashboards, automating business flows, or designing analytics portals for users. I love helping people make smarter decisions through clean, clear, and compelling visuals. Bonus points if I get to mix in some graphic design or web dev too!
I love working with startups, small businesses, researchers, and digital agencies—basically anyone who needs data transformed into insight, or ideas brought to life online. Whether you're running a social media campaign, building your first website, or analyzing customer behavior, I’m here to help make it all click.
Absolutely! I’m all about flexibility. Whether you need a quick dashboard, a one-time data analysis, or a complete website build, I offer both one-off services and customizable packages to fit your needs and budget. Let’s chat and build something that works for you.
I’m big on using the right tools for the right goals! For data, I love Power BI, Excel, R, and Python. For creative and web work, it’s WordPress, Duda, Figma, Canva, and Adobe Suite. And when it comes to workflow and automation—PowerAutomate, PowerApps, Draw.io, and Trello are my go-tos. I keep things efficient, clean, and visually engaging.
Whether you have a project in mind or just want to explore possibilities, I’d love to hear from you. Let’s connect and create something great together!